
Will the Santa Claus Rally Spark a Bullish Start to 2026?
Adam Turnquist | Chief Technical Strategist
Last Updated: December 23, 2025
The much-anticipated Santa Claus Rally period officially begins tomorrow. This historically strong seven-day stretch for stocks was first identified by Yale Hirsch in 1972. Hirsch, the creator of the Stock Trader’s Almanac, defined the period as the last five trading days of the year plus the first two trading days of the new year.
The Santa Claus Rally often grabs headlines because markets tend to deliver solid gains during this short window — or perhaps because it falls during a typically quiet news cycle. Either way, history shows a clear pattern: since 1950, the S&P 500 has averaged a 1.3% return during this period, with positive results occurring 78% of the time. For comparison, the market’s typical seven-day average return is just 0.3%, with a positivity rate of 58%.
That said, seasonal trends reflect historical tendencies, not guarantees. They don’t account for fundamentals like earnings, monetary and fiscal policy changes, or economic conditions. The last two years of negative Santa Claus Rally returns are a reminder that past performance is never a promise of future results.
Santa Claus Rally Returns (1950–2025)
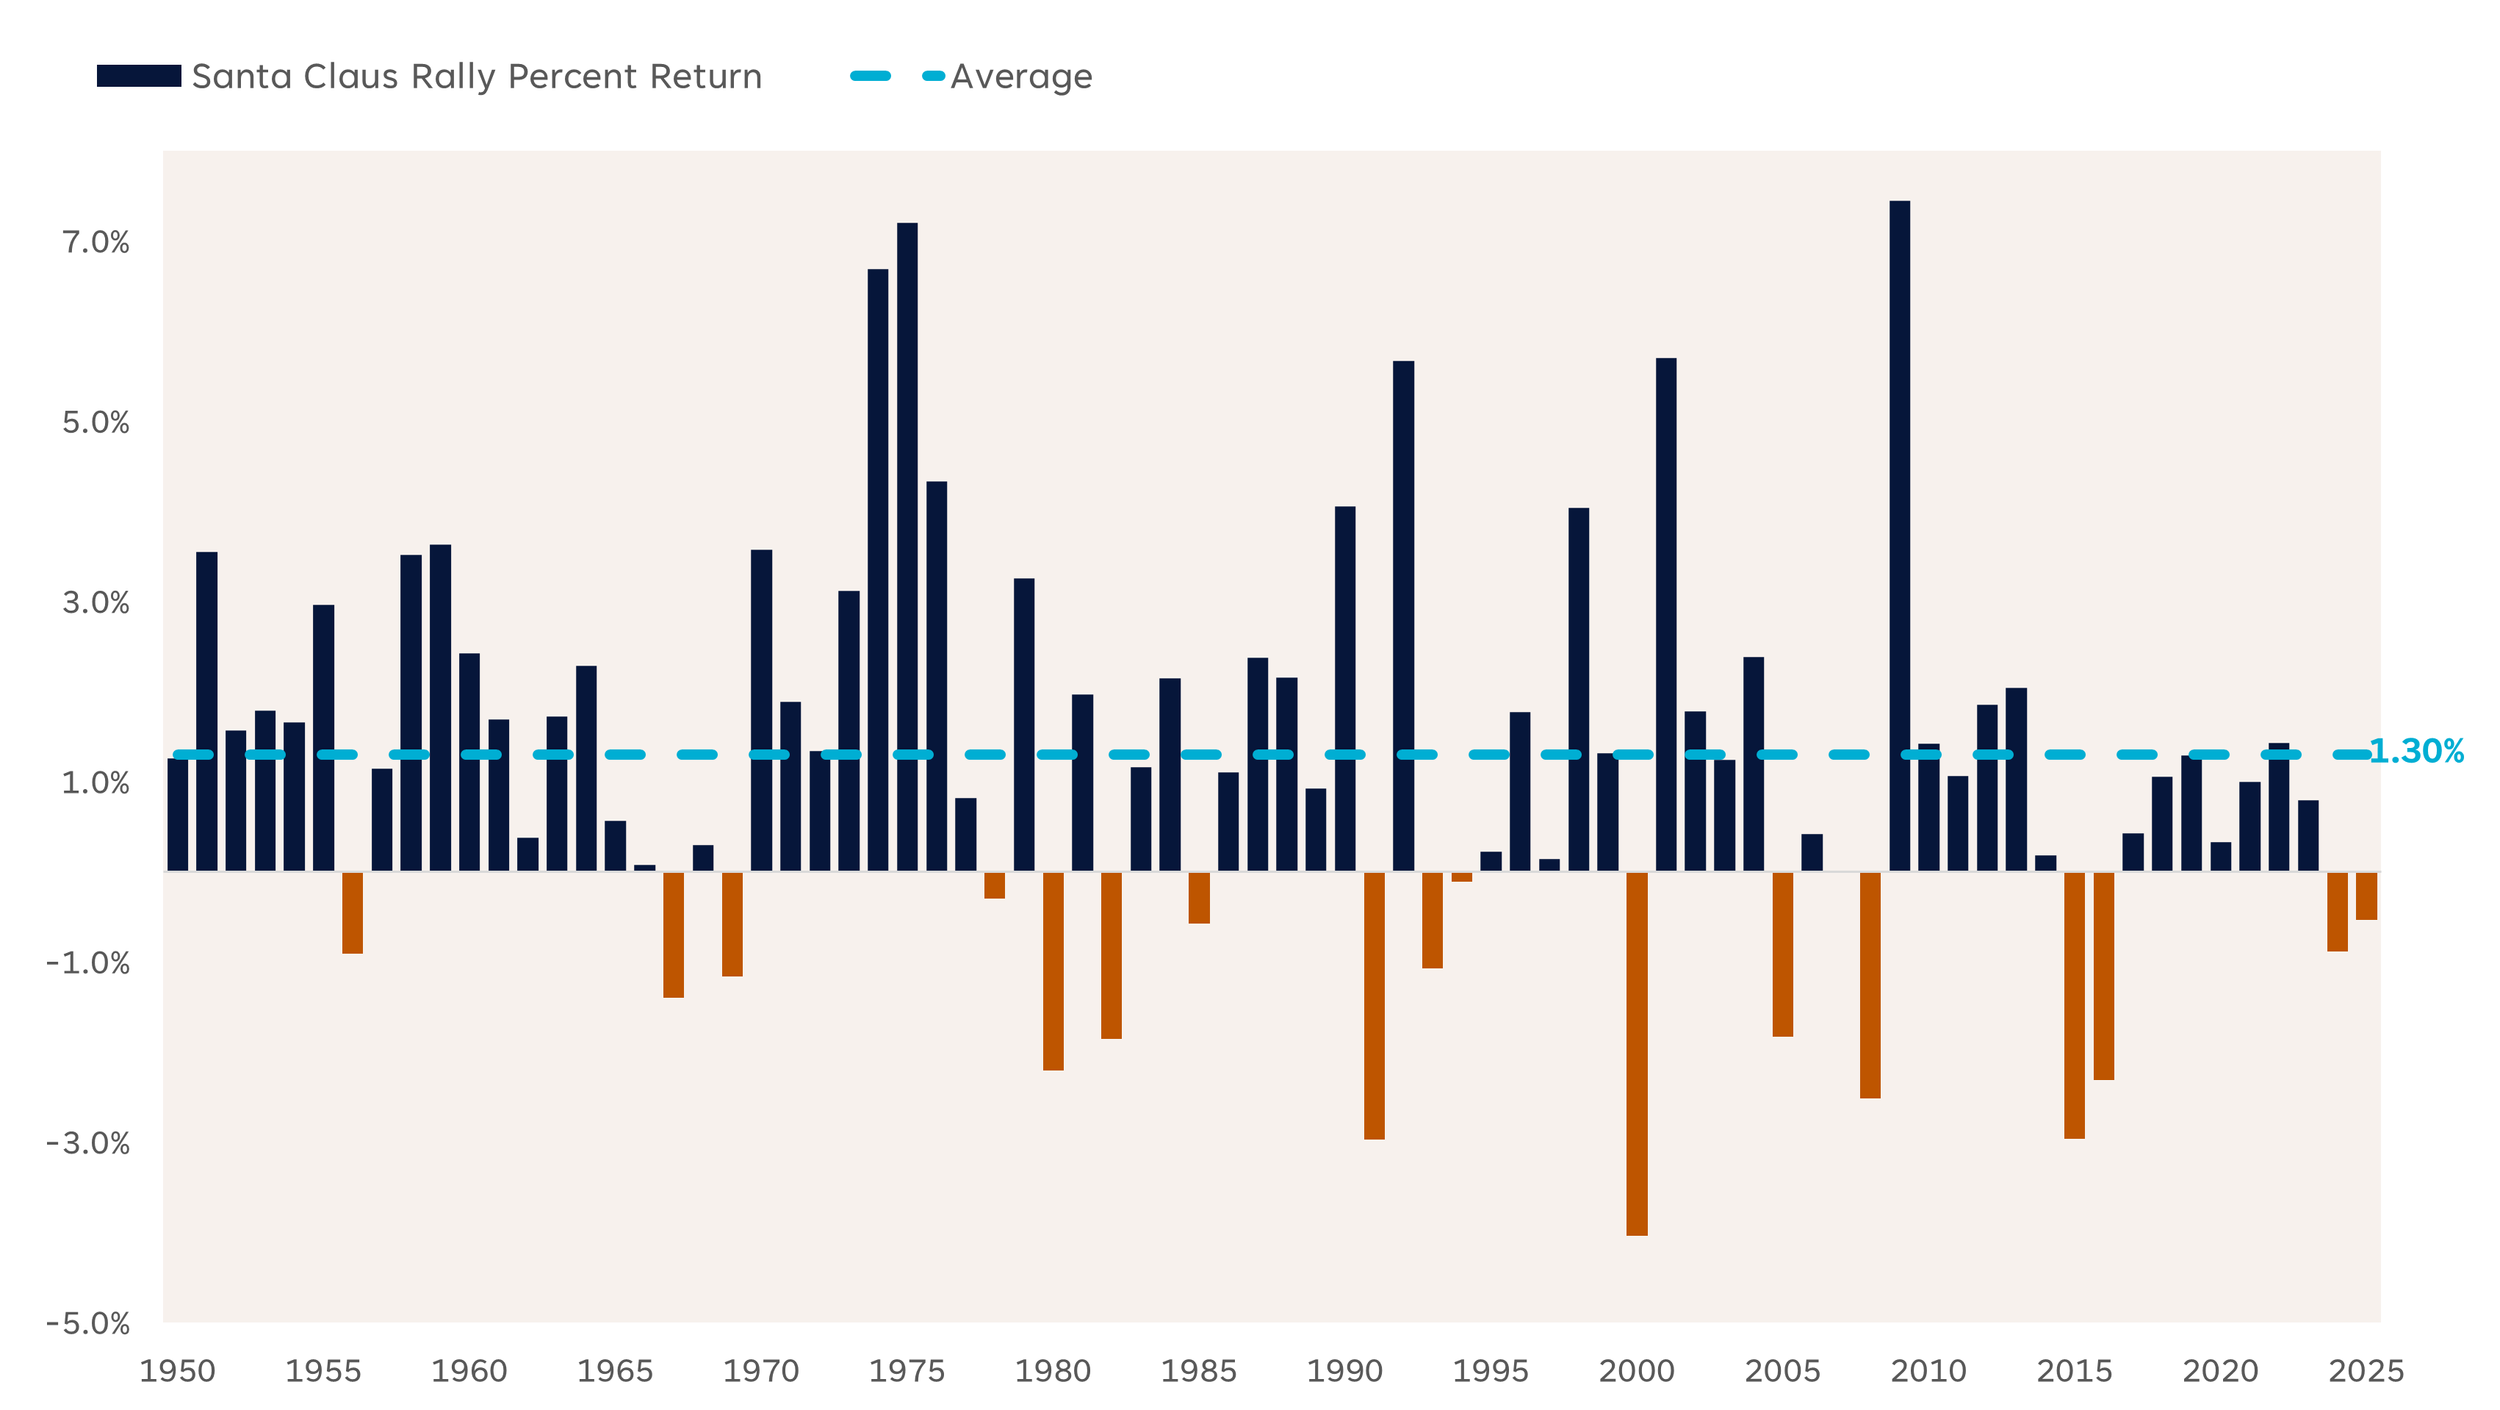
Source: LPL Research, Bloomberg 12/22/25
Disclosures: Past performance is no guarantee of future results. All indexes are unmanaged and can’t be invested in directly. The modern design of the S&P 500 stock index was first launched in 1957. Performance back to 1950 incorporates the performance of the predecessor index, the S&P 90.
The Naughty or Nice List
Another intriguing aspect of the Santa Claus Rally is its historical connection to January performance and the following year’s returns. Yale Hirsch captured this idea with his well-known phrase: “If Santa Claus should fail to call, bears may come to Broad and Wall.”
Historical data backs up this adage. When the rally is positive — putting investors on the “nice” list — the S&P 500 has delivered an average January gain of 1.4% and an impressive 10.4% return for the full year that follows. In contrast, when the index was down during this period — the “naughty” list — the averages dropped to only -0.1% for January and 6.1% for the subsequent year.
Naughty or Nice List Returns (1950–2025)
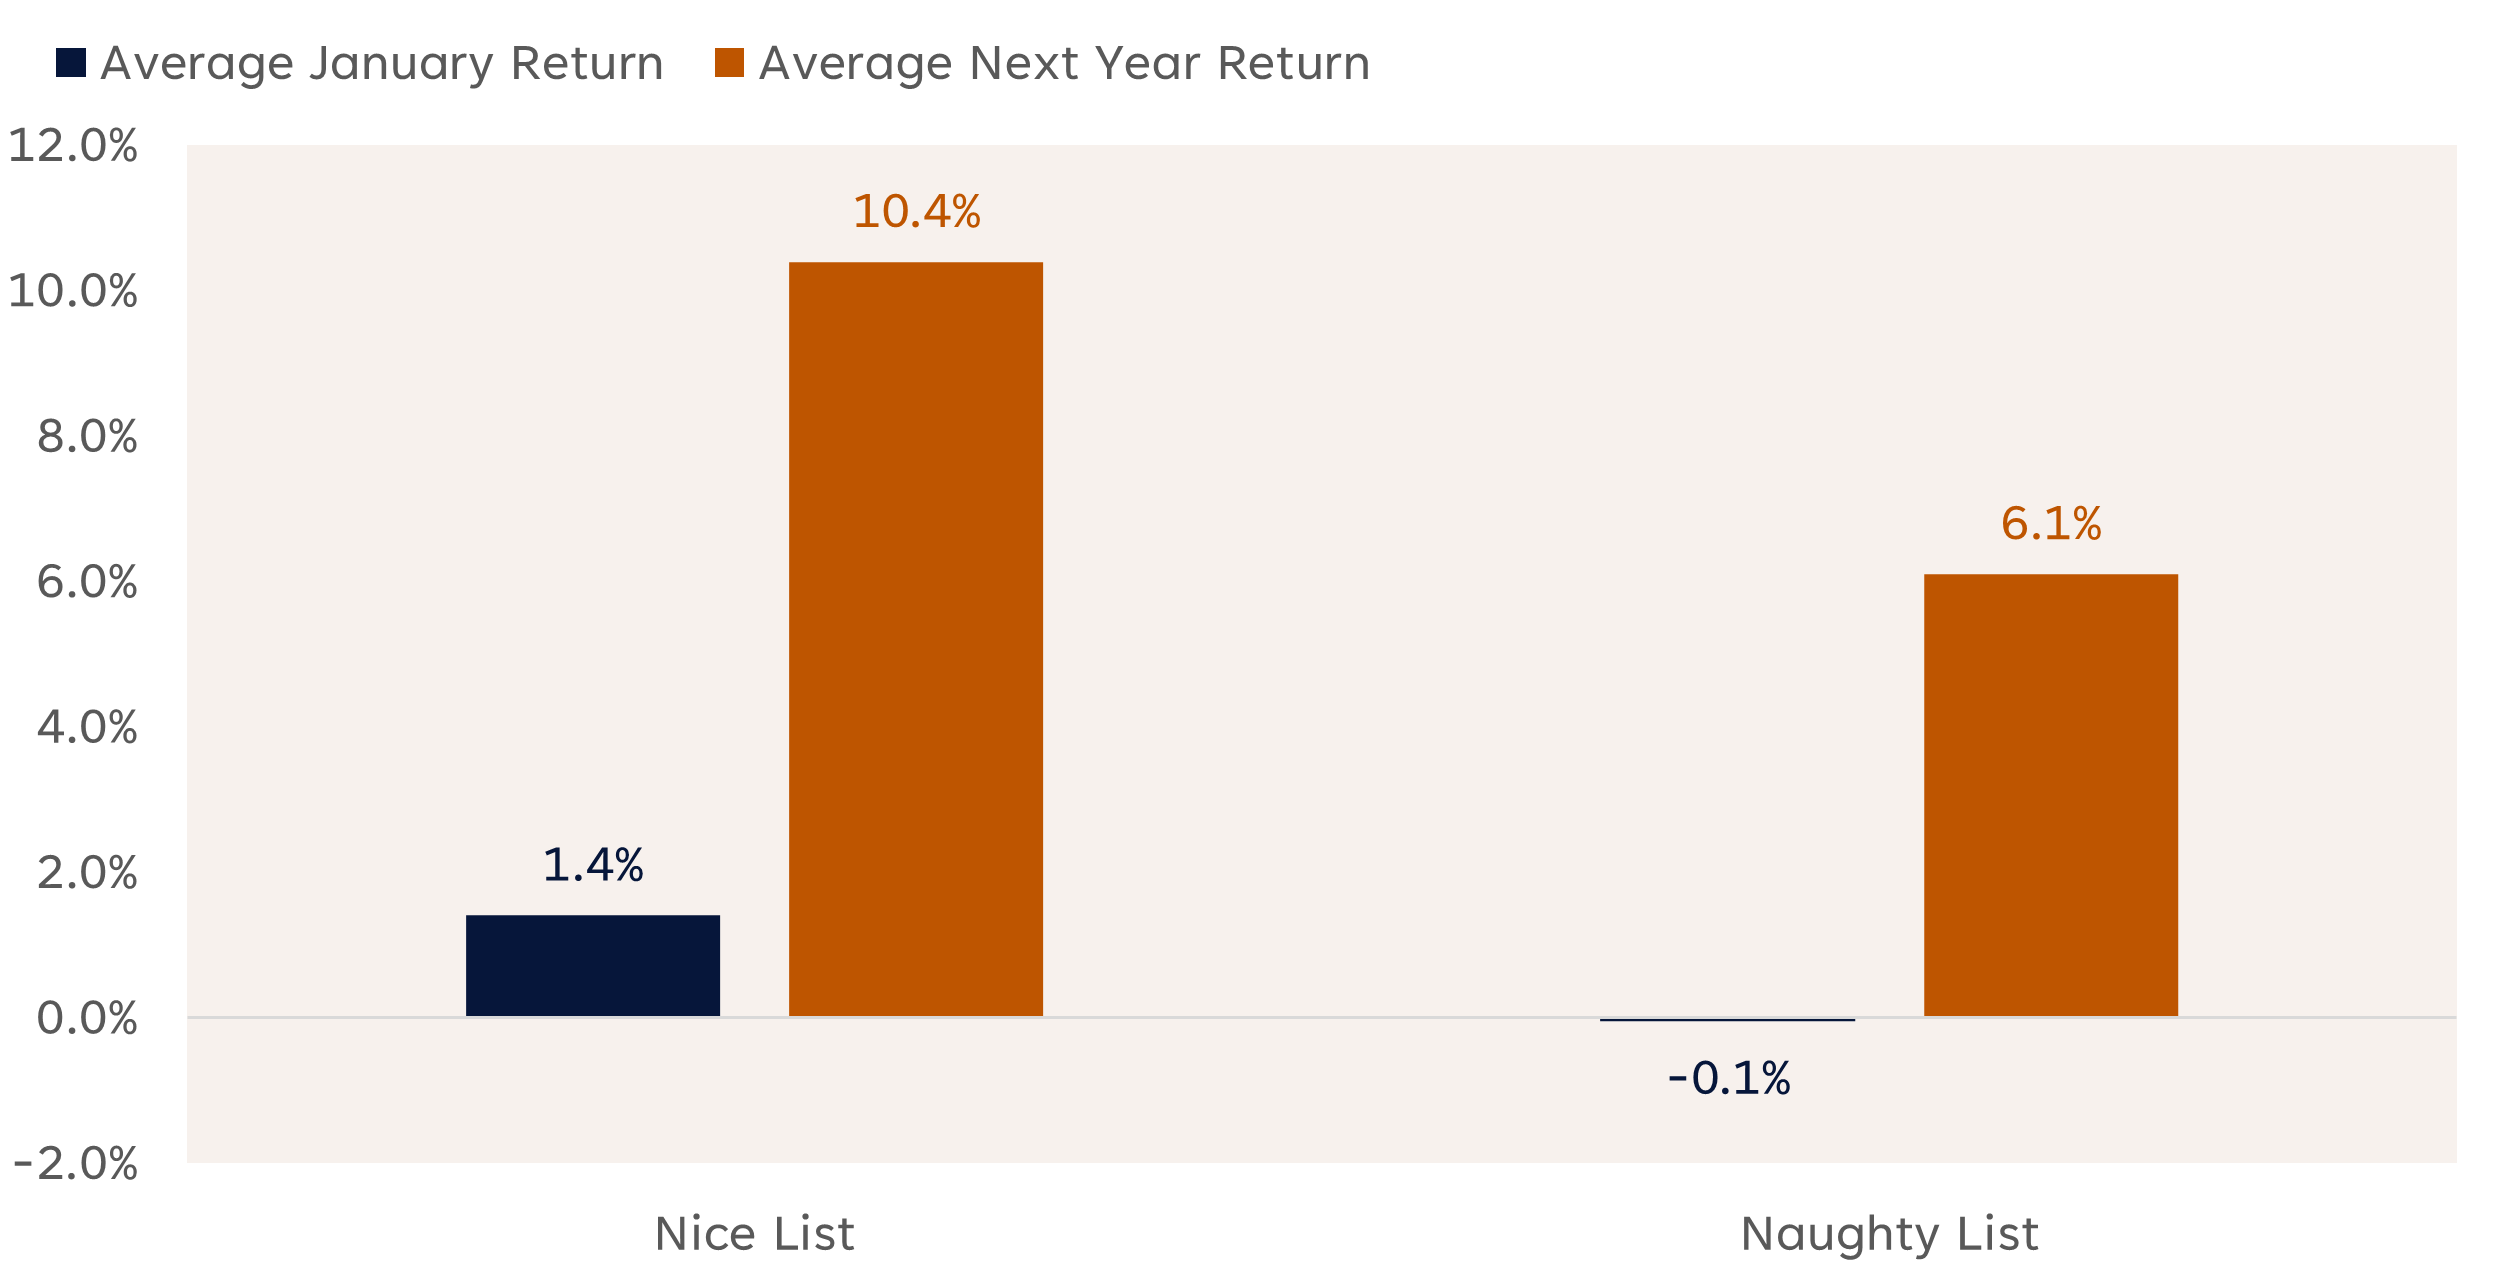
Source: LPL Research, Bloomberg 12/22/25
Disclosures: Past performance is no guarantee of future results. All indexes are unmanaged and can’t be invested in directly. The modern design of the S&P 500 stock index was first launched in 1957. Performance back to 1950 incorporates the performance of the predecessor index, the S&P 90.
Technical Perspective
The technical backdrop remains supportive of a year-end rally, raising the possibility that the S&P 500 could avoid an unprecedented third consecutive year of negative Santa Claus Rally returns. Recent strength has lifted the index back above its 20- and 50-day moving averages (dmas), with the December highs at 6,901 now serving as the next major resistance level to clear. A sustained breakout above this threshold would complete the ongoing multi-month consolidation phase and generate a minimum technical-based price objective of around 7,270.
Market participation has also improved as stocks recovered from November’s pullback. Leadership has shifted toward more economically sensitive sectors, signaling a renewed appetite for risk. Financials, industrials, and materials have shown notable internal strength, with a growing share of constituents hitting new four-week highs. This marks a sharp reversal from November, when investors favored defensive areas like healthcare and energy.
Conclusion
Momentum heading into year-end suggests a favorable setup for a positive Santa Claus Rally — a historically bullish signal for January and the year ahead. While overall market breadth remains somewhat narrow for an index near record highs, the trend is moving in the right direction, supported by a rotation toward cyclical sectors. A close above the S&P 500’s December high could pave the way for the next leg higher above the 7,000-point milestone.
However, risks remain. Increased scrutiny over artificial intelligence — given lofty expectations for earnings and spending — could weigh on sentiment. Inflation concerns may also resurface, reducing prospects for rate cuts, while continued labor market weakness could add to economic uncertainty. Additionally, 10-year Treasury yields are hovering just below key resistance at 4.20%. A breakout above this threshold could push yields toward 4.50%, potentially dampening the recent rebound in equity markets.