
Midterm Elections: Volatility Creates Opportunity
Jeff Buchbinder | Chief Equity Strategist
Last Updated: July 22, 2026
Additional content provided by Kent Cullinane, CFA, Sr. Analyst, Research.
Why Does Midterm Election Volatility Create Opportunity?
With midterm elections fast approaching, history suggests investors may be better served focusing on market behavior rather than political predictions. As LPL Research highlighted in its Midyear Outlook 2026: Policy, Buildouts, & Bottlenecks, our base case is a split Congress. In that environment, investors should expect fewer large legislative changes and more volatility around key issues like government funding and the debt ceiling. With major bills harder to pass, policy momentum is likely to shift away from Congress and toward the executive branch, where action can be taken through executive orders and regulatory rulemaking.
Policy Uncertainty, Market Volatility
A divided Congress typically reduces the likelihood of sweeping legislative changes, but it can also increase uncertainty around government funding, fiscal policy, and regulatory initiatives. That uncertainty often translates into market volatility, particularly during the months leading up to the midterm elections.
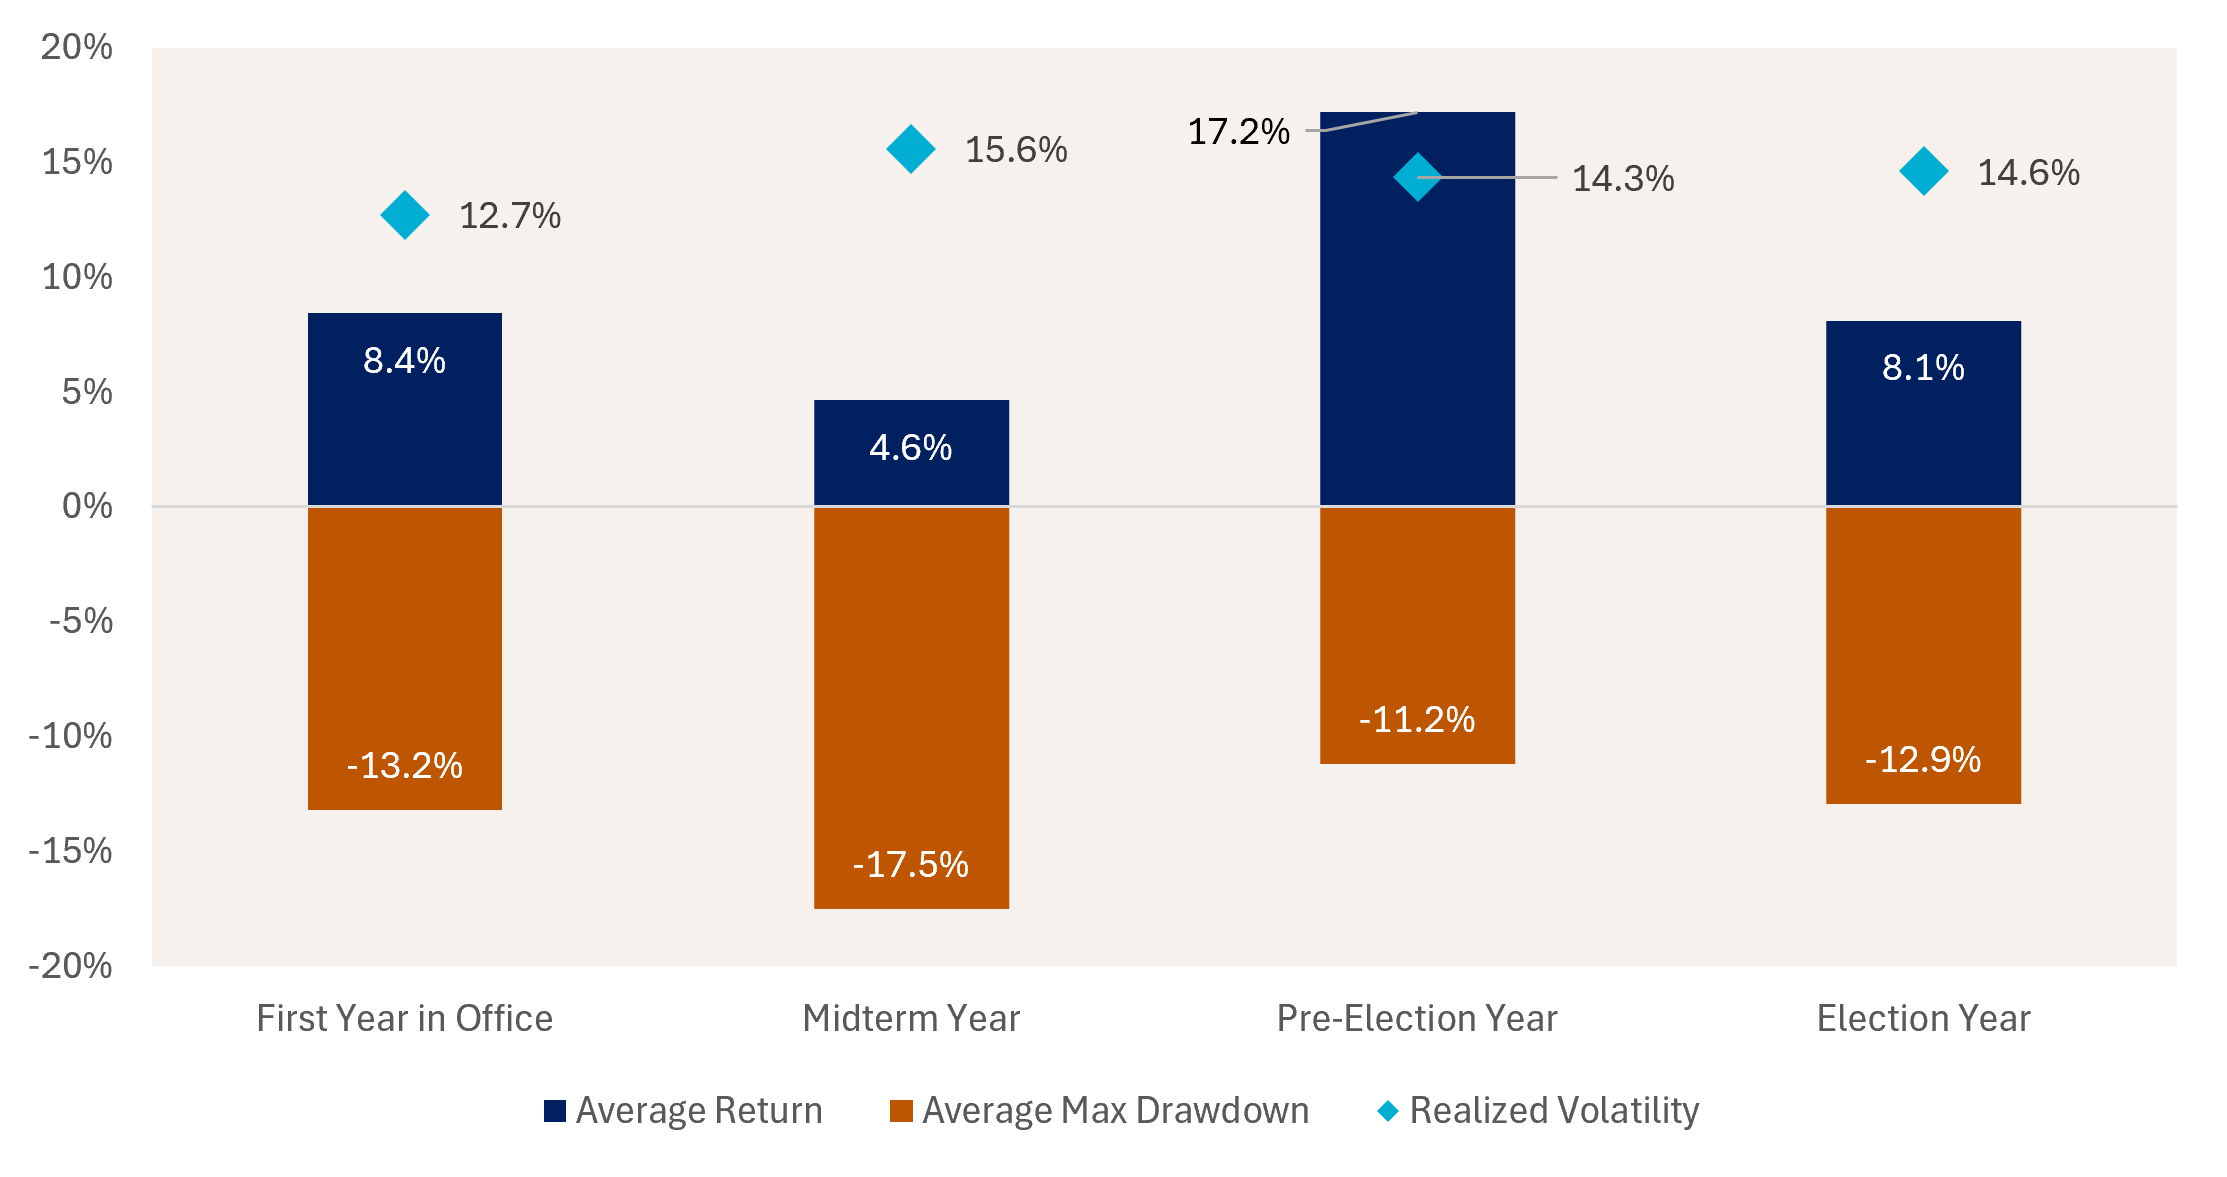
Markets generally dislike uncertainty, and midterm years have often been accompanied by larger drawdowns and elevated volatility compared with other years in the presidential cycle. Looking at the “Equity Performance in Past Presidential Cycles” chart below, midterm years have produced the weakest average annual return of the four-year presidential cycle at just 4.6%, while also generating the largest average drawdown at -17.5% and the highest realized volatility.
The Historical Setup Improves After Midterms
Fortunately, the story does not end there.
While midterm years have historically been challenging, they have often laid the groundwork for stronger subsequent performance, though past performance does not guarantee future results. The year following midterm elections, the pre-election year, has generated the strongest average annual S&P 500 return at 17.2%, significantly above returns during first-year, election-year, and midterm-year periods.
Equity Performance in Past Presidential Cycles (1948–2025)
Source: LPL Research, Bloomberg 07/17/26
Disclosures: Past performance is no guarantee of future results. The modern design of the S&P 500 stock index was first launched in 1957. Performance back to 1950 incorporates the performance of the predecessor index, the S&P 90.
The S&P 500 has risen during the 12 months following midterm elections 18 straight times back to 1954, with an average gain of 18.2%. 18 for 18!
The pattern reflects a common market tendency: uncertainty peaks ahead of the election and begins to fade once the outcome becomes known. Investors gain greater clarity on the policy landscape, allowing attention to shift back toward fundamentals, such as economic growth, earnings, and monetary policy.
Focus on Fundamentals, Not Headlines
This historical backdrop aligns with LPL Research’s Strategic & Tactical Asset Allocation Committee (STAAC) view. Although election-related uncertainty may create bouts of volatility through the second half of 2026, the broader environment remains supported by resilient economic growth, strong AI-driven capital investment, and continued earnings expansion.
For investors, the key takeaway may be simple: political outcomes matter, but market behavior around those outcomes matters more. If history is any guide, periods of election-related weakness have frequently presented attractive opportunities for long-term investors willing to deploy capital when uncertainty is highest.
In other words, while midterm years may test investors’ patience, they may reward discipline. Rather than attempting to predict election winners, investors may benefit more from preparing for the volatility that accompanies the process — and remaining ready to lean into opportunities once the uncertainty begins to clear.