
Defense Takes the Field
Adam Turnquist | Chief Technical Strategist
Last Updated: September 12, 2024
Increased volatility over the last several weeks has reshaped the equity market leaderboard. Capital has flowed out of technology and other cyclical areas of the market and into more defensive sectors. Signs of slowing economic growth, notably in the labor market, weak seasonality, political uncertainty, elevated valuations, and frothy sentiment — especially in the big tech, artificial intelligence, and semiconductor space — have all been contributing factors behind the rotation. The silver lining to this backdrop (aided by cooling inflation data) is a highly anticipated monetary policy pivot from the Federal Reserve (Fed) next week. Fed funds futures point to a 100% probability for a 0.25% interest rate reduction on September 18, with only a 14% probability for a 0.50% reduction.
While a transition to easier monetary policy is welcome news for a slowing economy, recent selling pressure in stocks has created some shorter-term technical damage on the S&P 500. The index has pulled back after failing to reach the July highs. Momentum indicators turned negative after the lower highs and breadth in tech and more cyclical areas of the market (outside of financials) deteriorated. It is important to note that overall breadth metrics still remain constructive, but their direction is a concern.
What has stood out over the last several weeks is the shift toward defensive leadership. The chart below compares the consumer staples, utilities, and health care sectors to the S&P 500 to help determine relative trend direction and strength. A rising ratio chart is indicative of the sector outperforming the broader market, and vice versa.
As highlighted below, each sector recently reversed downtrends relative to the broader market. This marks an important character change in this market as technology, semiconductors, and more cyclical sectors have started to lose their leadership status. Building relative strength in more defensive sectors suggests investors are losing risk appetite and rotating toward more recession-proof or less volatile areas of the market — not the type of leadership you want to witness in a recovery period toward the prior highs. Furthermore, the last time these sectors entered relative uptrends served as a prescient warning signal for stocks in early 2022.
Defensive Sectors Are Starting To Outperform

Source: LPL Research, Bloomberg 09/12/24
Disclosures: Past performance is no guarantee of future results. All indexes are unmanaged and can’t be invested in directly.
The Best Offense Is Sometimes a Good Defense
To further illustrate the importance of defensive leadership changes in the market and how active management can help deliver outperformance, we created a hypothetical long-only trading model based on the S&P 500 and a “defensive basket,” defined as the consumer staples, utilities, and health care sectors (each given 1/3 weightings). The model parameters are outlined below:
Defensive Rotation Model Parameters:
Started with a $100,000 investment in 1994.
Initiates a theoretical long position in the S&P 500 whenever the consumer staples, utilities, and health care sector ratio charts (vs. the S&P 500) were below their 200-day moving average (dma).
Initiates a theoretical long position in the defensive basket whenever the consumer staples, utilities, and health care sector ratio charts (vs. the S&P 500) were above their 200-dma.
The model is always long either the S&P 500 or the defensive basket.
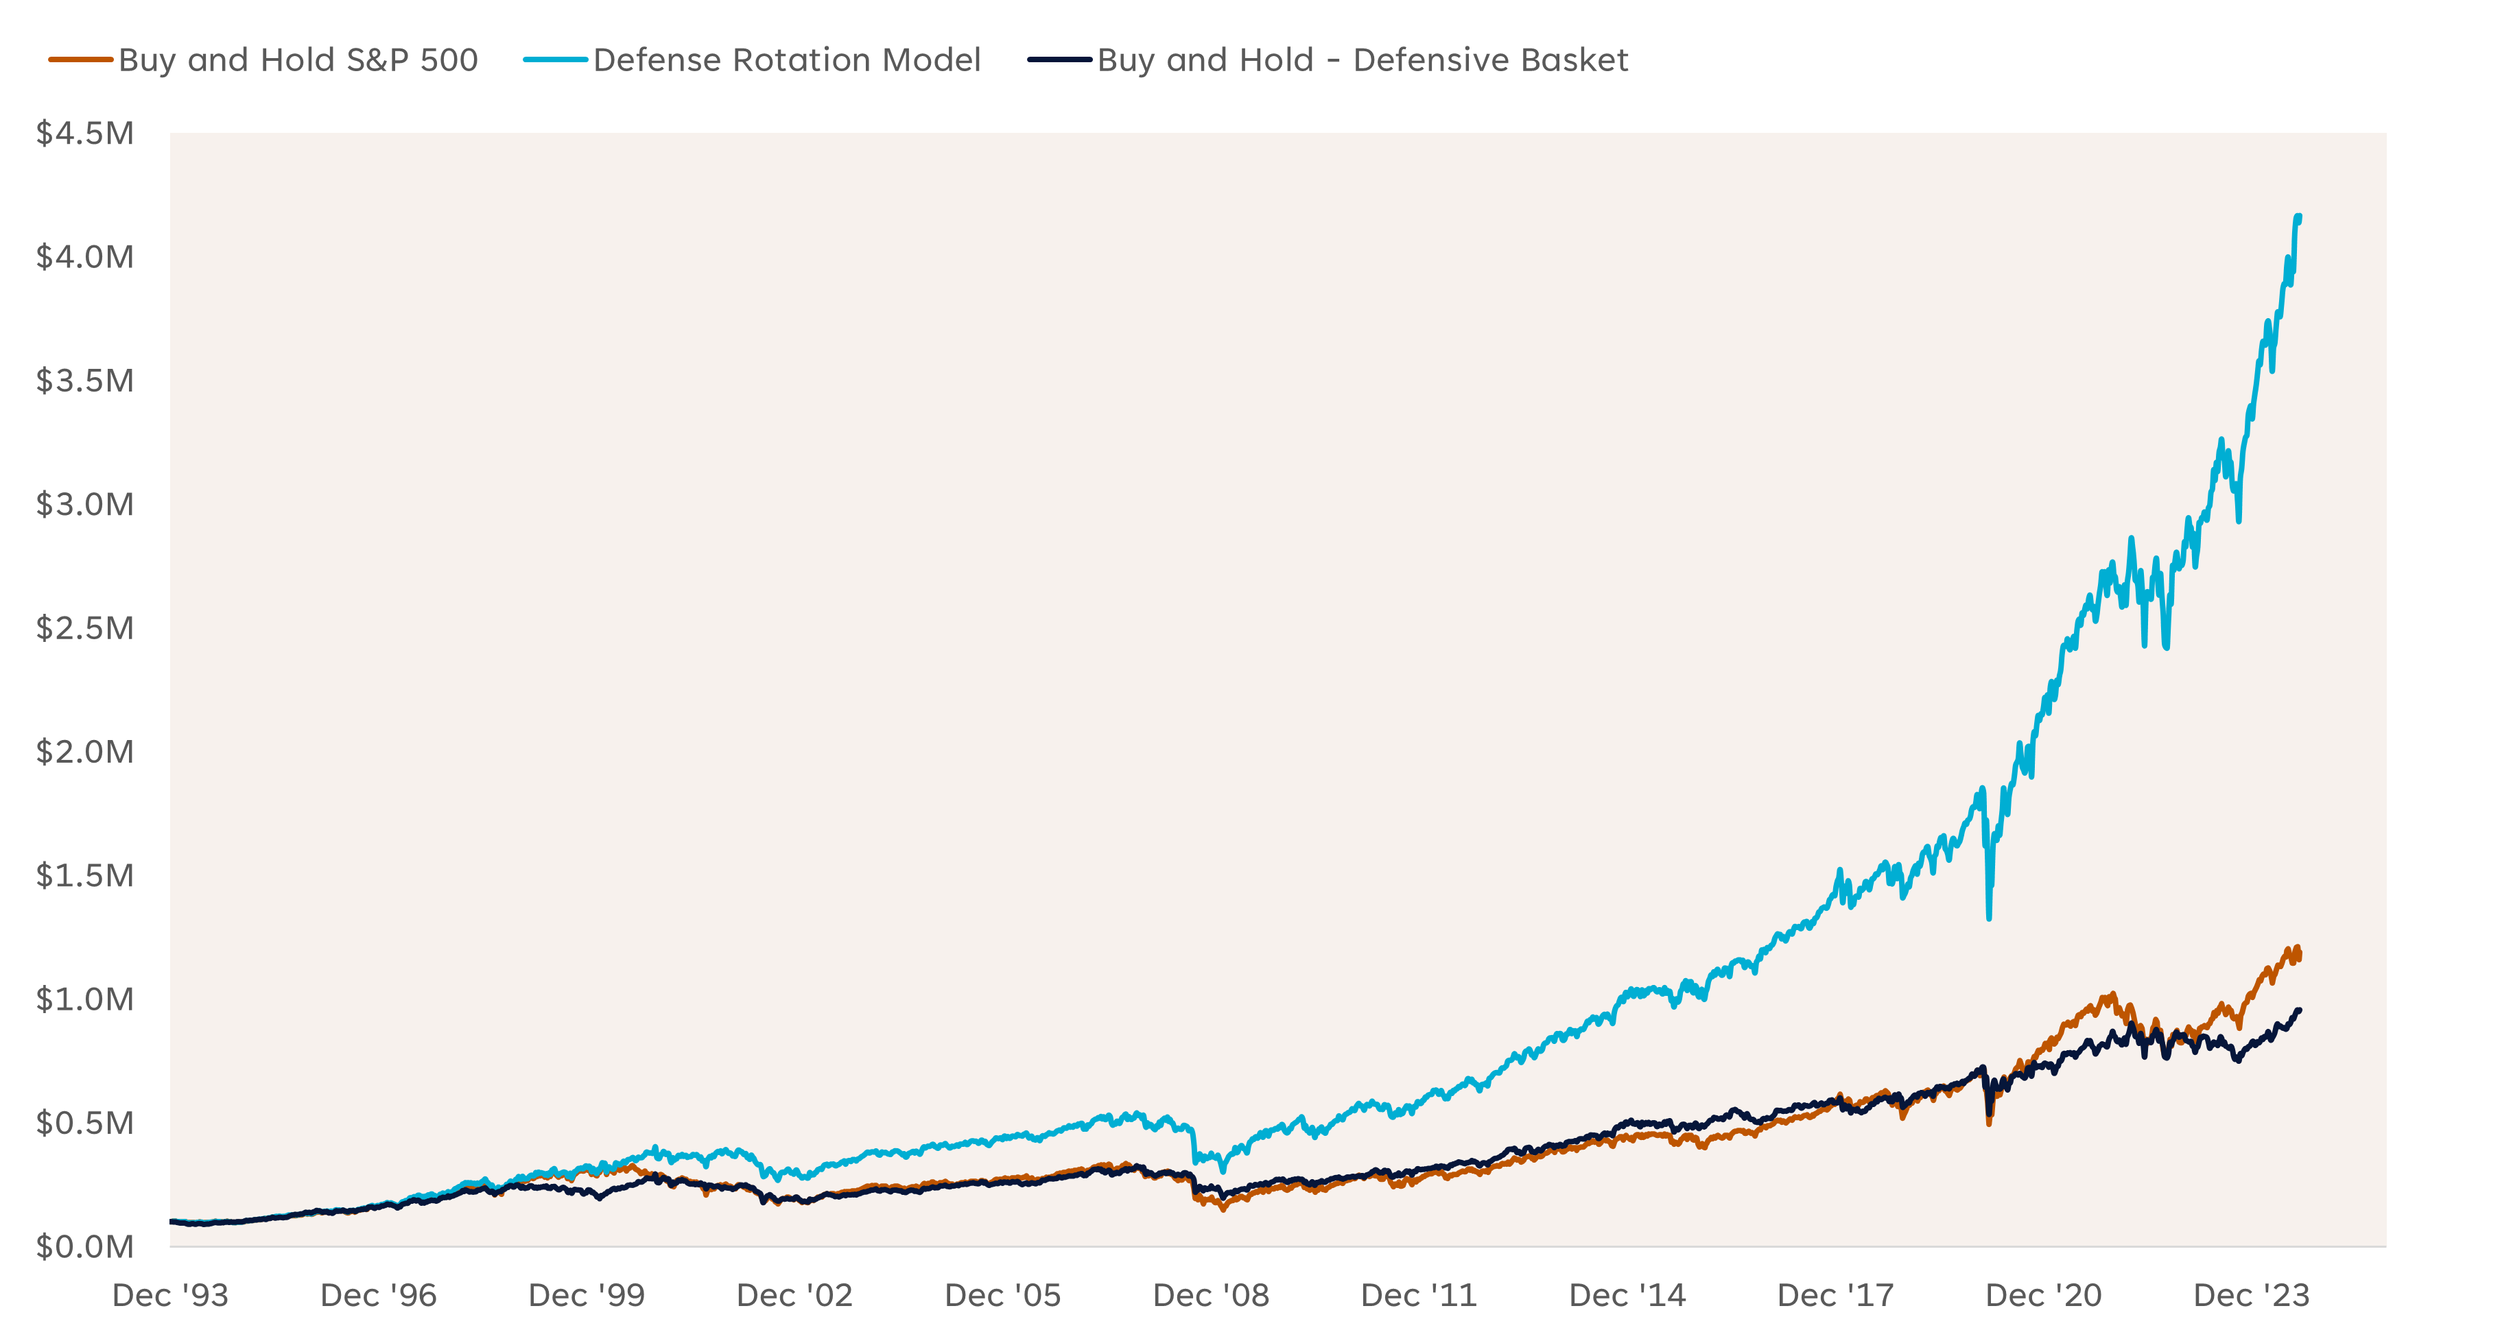
The chart below highlights the performance of the model compared to a buy-and-hold strategy of the S&P 500 and the defensive basket. The defensive rotation model generated a net return of $4.2 million during this period, compared to a net return of $1.2 million for owning the S&P 500 or just under $1 million for owning just the defensive basket. These dollar amounts equate to annualized returns of roughly 13.2%, 8.6%, and 7.8% respectively, and do not include dividends/reinvestments or incorporate trading costs. For additional context, the model rotated into the defensive basket 42 times over the backtested period.
Defensive Rotation Model vs. the S&P 500 (1994-YTD)
Source: LPL Research, Bloomberg 09/12/24
Disclosures: Past performance is no guarantee of future results. All indexes are unmanaged and can’t be invested in directly.
Summary
Recent changes to market leadership should be viewed as a warning sign for waning risk appetite. Breakdowns in 10-year Treasury yields, crude oil, and several industrial metals also fit this narrative. While we do not view these recent changes as an imminent threat to the longer-term bull market, they do suggest investors should buckle up for additional volatility this fall and that now may not be the best time to add equity risk exposure.
LPL’s Strategic and Tactical Asset Allocation Committee (STAAC) maintains its neutral stance on equities, while actively monitoring economic data, corporate profits, and technical analysis signals for potential opportunities to add equity exposure. The Committee maintains its modest overweight to fixed income, funded from cash, which may help buffer against equity market volatility should economic conditions worsen, while also providing attractive income.